
Video on the web currently develops towards an open playground, where the video data itself can be freely accessed, analyzed, controlled and remixed. In this environment, a video file is completely seperated from its visual representation in the browser and any control interfaces. Despite browser vendors implementing their own standard video controls, it is up to any developer to build custom players and thus re-interpret the way we consume web-native film.
One element that is already an important part of every video player is the timeline. In the future, timeline visualizations and interfaces will become fundamental. A timeline is the only element that can comprise or at least represent in some form the actual contents of an entire timebased creation. It can not only be used to navigate within a certain timeframe, but also to provide hints on all sorts of contentual attributes. In this article, I will focus on so called “mood bars” as a powerful visualization method for video timelines.
What is a Mood Bar?
Mood bars are a visualization technique originating in the visual display of audio tracks within various music players. A mood bar consists of a horizontal timeline that is divided into multiple vertical stripes. Each stripe represents a part of the audio track through a color. The color value is hereby derived from the sound spectrum or other audio features.
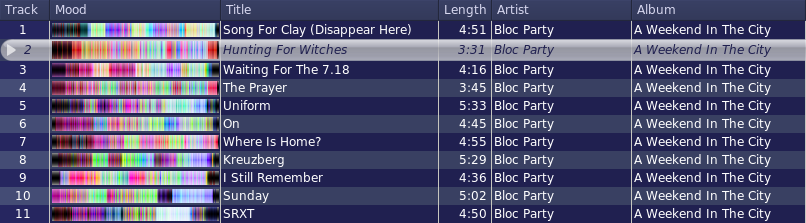
Mood Bars in Amarok Music Player (Screenshot by “Jim&0wen”, CC-BY-3.0)
The concept of the “mood bar” has been introduced by Wood and O’Keefe in 2005 [1] for the purposes of “Music Information Retrieval” and relies, guess what, on the fact that our choice of music depends on our current mood [2].
Video Mood Bars and Visualization Techniques
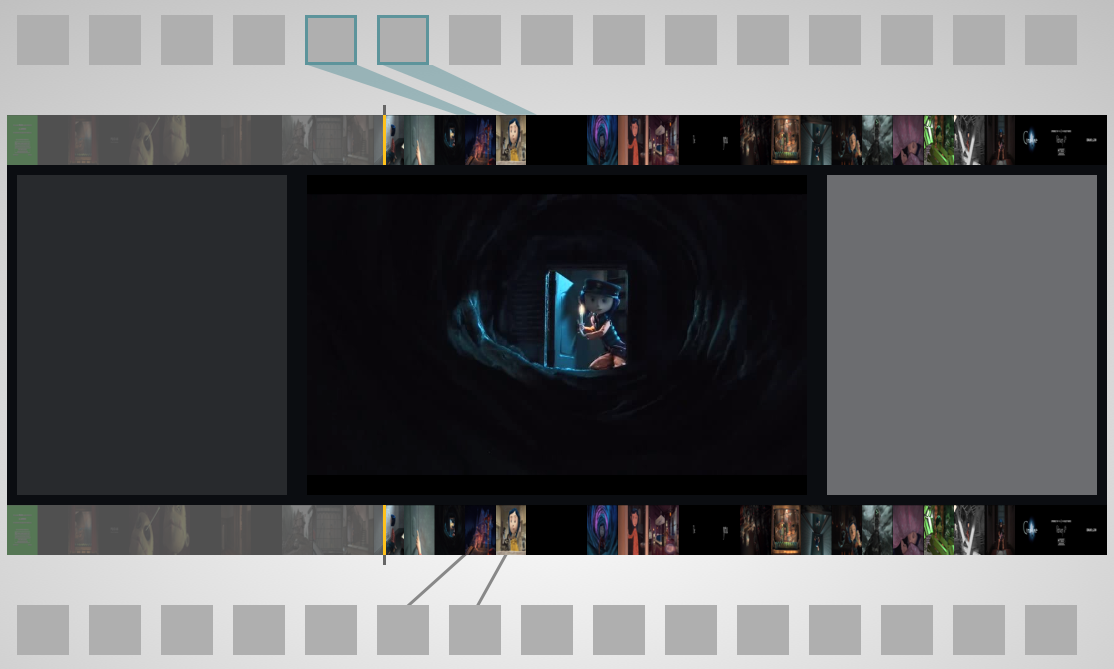
Even though it seems logic to expand the usage of mood bars from pure audio to audio-visual contents, I have not yet spotted any player or interface that actually works with this technique (please correct me if I’m wrong). For the use within a video-based environment, we have to find new features to analyze. The simplest “feature” would just be the keyframes of the video. By arranging a certain number of keyframe thumbnails relative to a video timeline, one can get a good clue on the visual mood at certain points of time:

Video Frame Thumbnails
With an increasing number of frames, this technique proves to be not very god for generating visually diverse areas.
A powerful technique to visualize more video contents with the same amount of retrieved frames is “slitscanning”:
Slitscan imaging techniques are used to create static images of time-based phenomena. In traditional film photography, slit scan images are created by exposing film as it slides past a slit-shaped aperture. In the digital realm, thin slices are extracted from a sequence of video frames, and concatenated into a new image.
(Source: G. Levin. An Informal Catalogue of Slit-Scan Video Artworks, 2005.)
The following image shows the impact of this method using the same video contents. The only difference is that we do not grab the whole video frame, but rather a small strip. The strip (or slit) is taken first from the most left position on the frame. The next strip is then derived from the neighbouring position to the right in the next frame until we are at the very right position of a frame and the process repeats:

Slitscanning
While scenes with short cuts or fast movement look quite similar to the previous visualization, slow scenes and stills reveal much more now. The functionality can be implemented in various ways to create different effects. Sha Hwang for instance built a tool that creates slitscans for YouTube and Vimeo videos.
The choice of technique also depends on what the visualization is meant to get across. If the goal is to show as much of the visual contents as possible, slitscans may be a good idea. In areas where it is more important to be able to compare several clips visually, it may be the best to rely on the average frame color:

Average Color
This could be the case for media libraries or video retrieval in general, as the average colors allow through their comparability the implementation of visual rankings (“order by mood” etc.).
A nice use case for contentual attributes as a means to distinguish between videos has recently been released by Google with the YouTube Trends Map. The so called “demographic bars” consist of a background image that makes every video bar unique and recognizable. Instead of the average color, they use a heavily enlarged version of the video thumbnail, but it still works quite good:

Demos
HTML5 Video and the Canvas Element make it possible to retrieve and manipulate frames from the video and thus to generate mood bars live on the client-side of the browser. I put together a demo that shows the three discussed visualization techniques “thumbnails”, “slitscanning” and “average color”.
Feel free to study, remix and share!
Demo 1: Video Mood Bar Generator
(contrary to a timeline, the moodbar images are distributed evenly to allow a better comparison of the techniques)
Mood bars in the wild:
I started experimenting with mood bars a while ago, which is why the first prototype of my hypervideo project already contains them. In conjunction with the ambient background feature, the bars are meant to integrate the interface elements more into the film.
Demo 2: Interface with mood bar as timeline
References
[1] G. Wood and S. OKeefe. On Techniques for Content-Based Visual Annotation to Aid Intra-Track Music Navigation. In Proceedings of ISMIR 2005, 6th International Conference on Music Information Retrieval, pages 58–65, 2005.
[2] M. Schicker. Audiophield: Exploring casual collaborative browsing of large music collections. Diploma thesis, Ludwig Maximillian Universitaet, Munich, Germany, 2008.